Tsunami Modelling
This example demonstrates the capabilities of simulating wetting and drying processes in Fluidity. The event of interest is the Okushiri tsunami in 1993 caused by the Hokkaido Nansei-Oki earthquake offshore of southwestern Hokkaido Island, Japan. This earthquake reached a magnitude of 7.8 (Mw) and the resulting tsunami hit a sparsely populated part of the Okushiri island, Japan with a runup height of up to 30m. To investigate the danger of such events, the Research Institute for Electric Power Industry (CRIEPI) in Abiko, Japan constructed a 1/400 laboratory model of the area around the island (Liu, 2008). The following configuration simulates this laboratory setup and uses the experimental measurements to benchmark Fluidity.
Simulation setup
The simulation configuration resembles the experimental setup as closely as possible. The considered domain is a basin with walls on each side except the left where the water level is enforced. The basin measures 5.448m x 3.402m and the bathymetry and coastal topography correspond to measurement data, see Figure 10.32. Three surface elevation gauge stations were deployed in the experiment. Detectors extract the surface elevation information at every timestep.
The mesh used for the simulation is a single layer horizontally unstructured mesh consisting of 19,506 tetrahedral elements with increased resolution near the inundation areas. The equations are solved with the P1 - P1 finite element pair, a backward Euler time discretisation with a time-step of 0.1s. The wetting and drying algorithm in Fluidity requires the user to set a minimal water level thickness, which is here set to 0.5mm. If the water surface reaches that level at a point, this point is defined to be dry. The isotropic kinematic viscosity and gravity magnitude are set to 0.01m2s-1 and 9.81ms-2, respectively. On the left boundary the tsunami wave is prescribed and no-normal flow boundary conditions are applied at the other sides of the domain and the bottom to resemble the solid boundaries in the experiment. In addition, a Manning-Strickler drag is used at the bottom with n = 0.002sm1/3. To prevent wave breaking in the simulation, this coefficient is increased to 0.2sm1/3 in a rectangular area with a side length of 0.5m centred at (3.4m, 1.7m) (which is the centre of the island in the domain) and a fourth order stabilization is applied to prevent wave breaking.
Results
The result of this example is shown in the figure below. The plot shows the surface elevation measurements at the three gauge stations of the laboratory experiment compared to the values from the simulation.
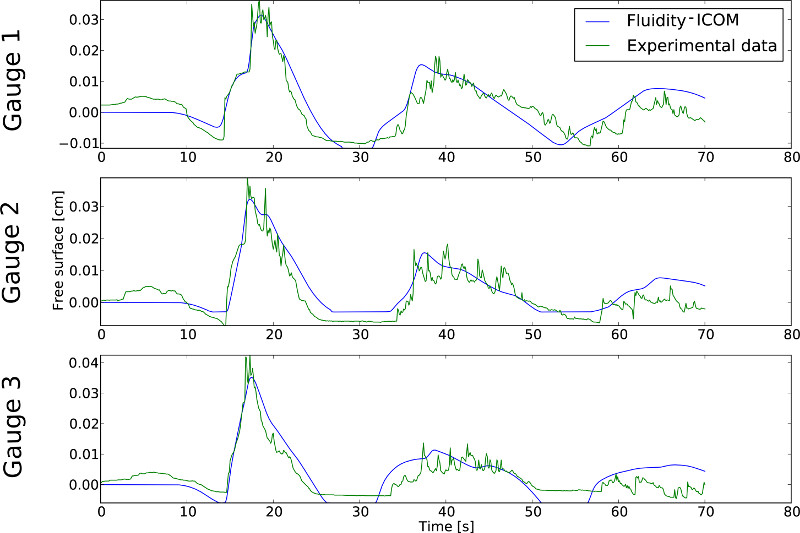
The numerical and experimental results at "Gauge 1" (top), "Gauge 2" (middle) and "Gauge 3" (bottom) in the domain.
References
- P.L.F. Liu (2008). Advanced numerical models for simulating tsunami waves and runup, volume 10. World Scientific Pub Co Inc.